Detailed Explanation
Speed optimizations. Profiling.
From the very beginning of the coreBOSCP project speed was an enormous problem, to the point where even the normal code-test-debug process was impractical. So our first optimization was to enable yii cache and use it to avoid calls to the REST interface. This was a pure gut feeling that turned out to make a big difference and make the development process acceptable. Once we had the basic functionality in place it was time to go further into profiling and speed optimizations to see if we could get it working faster: in came xdebug profiling
The first profiles confirmed our intuition as can be seen in the next images:
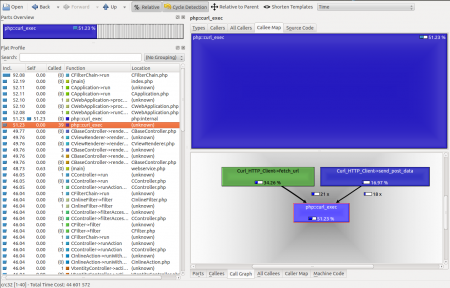
The most time consuming process is the call to coreBOS REST API using php_curl functions. After that, the next 5 consuming functions are all inside coreBOS, basically retrieving information. This is totally consistent and expected, after all, coreBOS is doing all the work, coreBOSCP is "just" a front end.
So my first step is to try to optimize the cURL call directly. I setup xdebug trace on send_post_data and get this:
TRACE START [2012-06-30 09:52:35]
   14.0689   12540840     -> curl_setopt() protected/components/vtwsclib/third-party/curl_http_client.php:154
   14.0689   12540920     -> curl_setopt() protected/components/vtwsclib/third-party/curl_http_client.php:157
   14.0690   12540840     -> curl_setopt() protected/components/vtwsclib/third-party/curl_http_client.php:170
   14.0690   12540920     -> curl_setopt() protected/components/vtwsclib/third-party/curl_http_client.php:173
   14.0690   12541072     -> is_array() protected/components/vtwsclib/third-party/curl_http_client.php:178
   14.0690   12542192     -> urlencode() protected/components/vtwsclib/third-party/curl_http_client.php:182
   14.0690   12542256     -> urlencode() protected/components/vtwsclib/third-party/curl_http_client.php:182
   14.0690   12542472     -> urlencode() protected/components/vtwsclib/third-party/curl_http_client.php:182
   14.0690   12542536     -> urlencode() protected/components/vtwsclib/third-party/curl_http_client.php:182
   14.0690   12542760     -> urlencode() protected/components/vtwsclib/third-party/curl_http_client.php:182
   14.0691   12542824     -> urlencode() protected/components/vtwsclib/third-party/curl_http_client.php:182
   14.0691   12544176     -> urlencode() protected/components/vtwsclib/third-party/curl_http_client.php:182
   14.0691   12544240     -> urlencode() protected/components/vtwsclib/third-party/curl_http_client.php:182
   14.0691   12544432     -> urlencode() protected/components/vtwsclib/third-party/curl_http_client.php:182
   14.0691   12544488     -> urlencode() protected/components/vtwsclib/third-party/curl_http_client.php:182
   14.0691   12543848     -> implode() protected/components/vtwsclib/third-party/curl_http_client.php:185
   14.0691   12545272     -> curl_setopt() protected/components/vtwsclib/third-party/curl_http_client.php:198
   14.0691   12545192     -> curl_exec() protected/components/vtwsclib/third-party/curl_http_client.php:202
   14.3222   12544216     -> curl_errno() protected/components/vtwsclib/third-party/curl_http_client.php:204
   14.3223   12544216     -> xdebug_stop_trace() protected/components/vtwsclib/third-party/curl_http_client.php:216
   14.3223   12544304
TRACE END   [2012-06-30 09:52:35]
Again, as expected, all the time is spent on the cURL call itself. This trace tells me that about 0.2534 seconds are spent on each call to this function and, of that time, 0.253 are spent on the curl_exec() function. This function is called about 39 times, so if we add the overhead that I am not counting of the rest of the functions, we are talking about 10 seconds to retrieve 4 products in a dedicated development server with both applications on localhost. Not much room for optimization!
Next I had a look at the information cURL returns to see if that could give some insight:
2012/06/30 12:34:09 [info] [application] array
(
    'url' => 'http://localhost/vtcpng/webservice.php'
    'content_type' => 'application/json'
    'http_code' => 200
    'header_size' => 315
    'request_size' => 310
    'filetime' => -1
    'ssl_verify_result' => 0
    'redirect_count' => 0
    'total_time' => 0.329784
    'namelookup_time' => 2.7E-5
    'connect_time' => 3.3E-5
    'pretransfer_time' => 3.8E-5
    'size_upload' => 75
    'size_download' => 166
    'speed_download' => 503
    'speed_upload' => 227
    'download_content_length' => 166
    'upload_content_length' => 75
    'starttransfer_time' => 0.329745
    'redirect_time' => 0
    'certinfo' => array()
    'redirect_url' => ''
)
2012/06/30 12:34:14 [info] [application] array
(
    'url' => 'http://localhost/vtcpng/webservice.php'
    'content_type' => 'application/json'
    'http_code' => 200
    'header_size' => 315
    'request_size' => 404
    'filetime' => -1
    'ssl_verify_result' => 0
    'redirect_count' => 0
    'total_time' => 0.283932
    'namelookup_time' => 2.4E-5
    'connect_time' => 2.9E-5
    'pretransfer_time' => 3.5E-5
    'size_upload' => 168
    'size_download' => 292
    'speed_download' => 1028
    'speed_upload' => 591
    'download_content_length' => 292
    'upload_content_length' => 168
    'starttransfer_time' => 0.283893
    'redirect_time' => 0
    'certinfo' => array()
    'redirect_url' => ''
)
2012/06/30 12:34:14 [info] [application] findallFromSearch: 4
2012/06/30 12:34:15 [info] [application] array
(
    'url' => 'http://localhost/vtcpng/webservice.php'
    'content_type' => 'application/json'
    'http_code' => 200
    'header_size' => 315
    'request_size' => 308
    'filetime' => -1
    'ssl_verify_result' => 0
    'redirect_count' => 0
    'total_time' => 0.248211
    'namelookup_time' => 2.3E-5
    'connect_time' => 2.7E-5
    'pretransfer_time' => 3.2E-5
    'size_upload' => 73
    'size_download' => 122
    'speed_download' => 491
    'speed_upload' => 294
    'download_content_length' => 122
    'upload_content_length' => 73
    'starttransfer_time' => 0.24817
    'redirect_time' => 0
    'certinfo' => array()
    'redirect_url' => ''
)
2012/06/30 12:34:16 [info] [application] array
(
    'url' => 'http://localhost/vtcpng/webservice.php'
    'content_type' => 'application/json'
    'http_code' => 200
    'header_size' => 340
    'request_size' => 259
    'filetime' => -1
    'ssl_verify_result' => 0
    'redirect_count' => 0
    'total_time' => 0.240644
    'namelookup_time' => 2.4E-5
    'connect_time' => 2.8E-5
    'pretransfer_time' => 3.4E-5
    'size_upload' => 1243
    'size_download' => 839
    'speed_download' => 3486
    'speed_upload' => 5165
    'download_content_length' => 839
    'upload_content_length' => 1243
    'starttransfer_time' => 0.000294
    'redirect_time' => 0
    'certinfo' => array()
    'redirect_url' => ''
)
2012/06/30 12:34:16 [info] [application] array
(
    'url' => 'http://localhost/vtcpng/webservice.php'
    'content_type' => 'application/json'
    'http_code' => 200
    'header_size' => 315
    'request_size' => 308
    'filetime' => -1
    'ssl_verify_result' => 0
    'redirect_count' => 0
    'total_time' => 0.265736
    'namelookup_time' => 2.2E-5
    'connect_time' => 2.6E-5
    'pretransfer_time' => 3.1E-5
    'size_upload' => 73
    'size_download' => 122
    'speed_download' => 459
    'speed_upload' => 274
    'download_content_length' => 122
    'upload_content_length' => 73
    'starttransfer_time' => 0.265697
    'redirect_time' => 0
    'certinfo' => array()
    'redirect_url' => ''
)
That did give me some more information and a few more hours of learning and testing. I set up this spreadsheet:
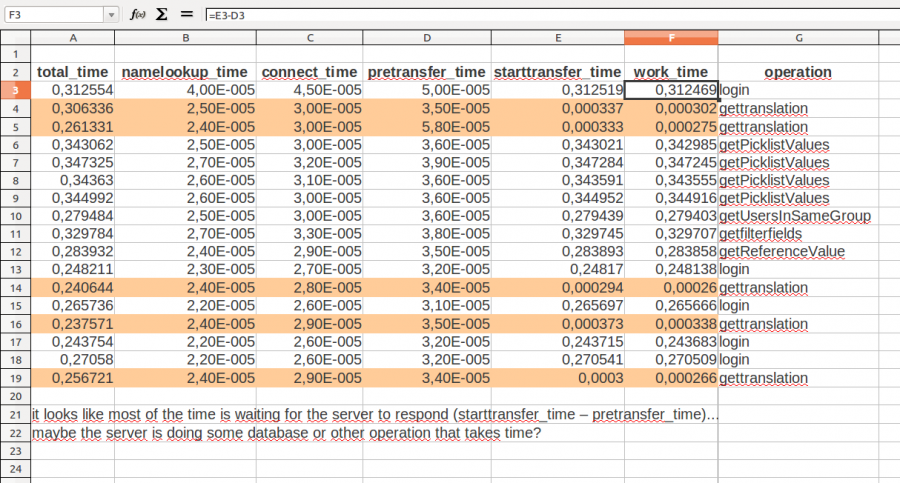
This called my attention to a few things. First the big difference between the majority of the calls and the gettranslation method. I looked at the gettranslation call and saw that this method simply does a few lookups in some files and arrays. No database access nor complex conditions, nor including of many files. So it isn't a question optimizing on the portal side but on the coreBOS side.
The other thing that caught my attention was how many login request were being made. After studying the code a bit I realized that Yii creates an object for each entity it retrieves from coreBOS and the way we have created the connection, each of these objects has their own connection. So this is something we will have to change to make it go a bit faster, but it will not make a significant change as we are already doing this indirectly. In our first optimization we activated Yii file level cache and cache the connection, so, although each object has their own connection object, in the end all these objects are all using the same connection. Note: I am profiling with the cache deactivated.
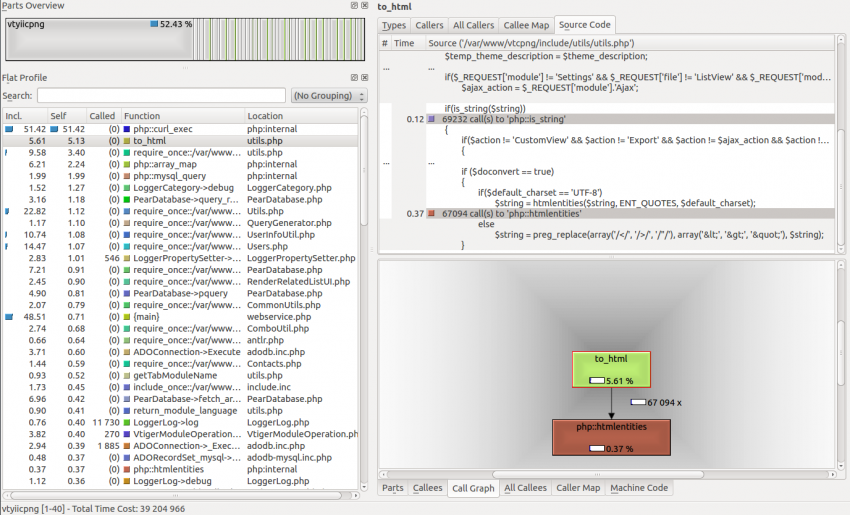
My next step was to have a look at the to_html() function inside coreBOS as it was next on the profile list. As can be seen by the profile, 69232 calls to is_string() which consume 0.11 seconds are made. There is little to be done here.
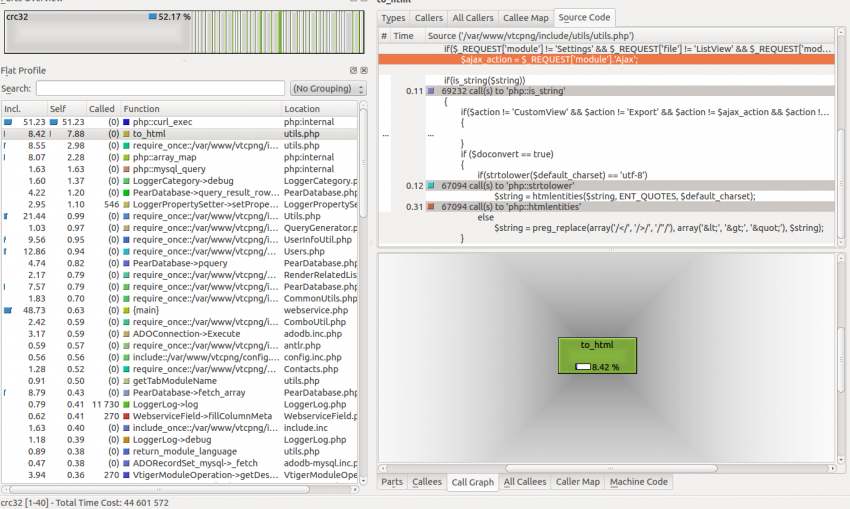
The next consumer is strtolower on $default_charset. This can be squeezed a bit. Simply by standarizing the $default_charset variable contents we can completely avoid this function. This is the necessary change:
Index: include/utils/utils.php
===================================================================
--- include/utils/utils.php (revisión: 346)
+++ include/utils/utils.php (copia de trabajo)
@@ -1031,7 +1031,7 @@
}
if ($doconvert == true)
{
- if(strtolower($default_charset) == 'utf-8')
+ if($default_charset == 'UTF-8')
$string = htmlentities($string, ENT_QUOTES, $default_charset);
else
$string = preg_replace(array('/</', '/>/', '/"/'), array('<', '>', '"'), $string);
Index: config.inc.php
===================================================================
--- config.inc.php (revisión: 346)
+++ config.inc.php (copia de trabajo)
@@ -162,6 +162,7 @@
// default charset
// default charset default value = 'UTF-8' or 'ISO-8859-1'
$default_charset = 'UTF-8';
+$default_charset = strtoupper($default_charset);
// default language
// default_language default value = en_usWith this change in place the new profile of this function changes completely:
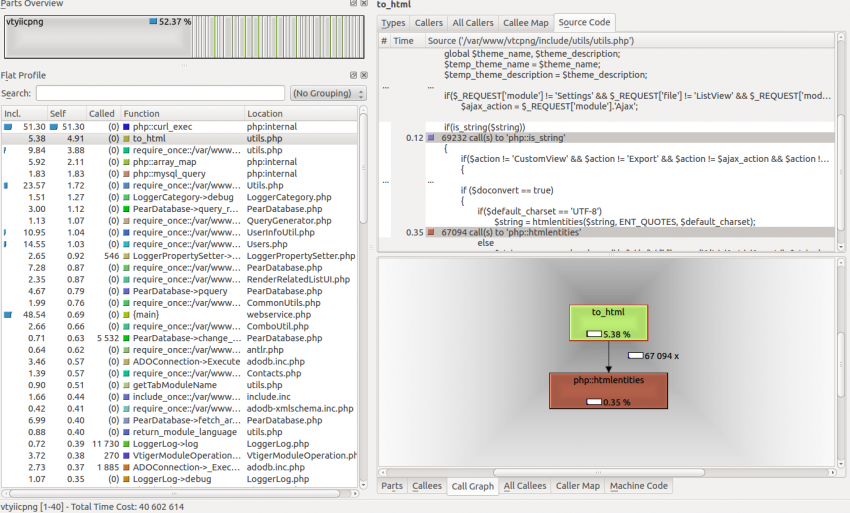
We have optimized the code in such a way that the comparison isn't even mentioned, with a significant reduction of time (from 44 to 40). But there is more to be obtained here. A search through the code shows that this same optimization can be applied again in various parts, one specially important in the database access. The final complete patch can be accessed on the ticket and in github and here is an image of a new profile where we have reduced the total time to 39.
That is about all I can do. The next step is restructuring the includes to only load the functions that are really needed, but I guess that activating php and yii cache we can get an acceptable system.
Further considerations.
http://serverfault.com/questions/106022/curl-taking-long-time-when-not-specifing-i-p-address
Use sockets? http://stackoverflow.com/questions/8442150/php-transfer-data-between-2-remote-servers-what-is-fastest-way