Forecast and Budget Control module
- Name:
- Forecast and Budget Control
- Type:
- module
- Description:
- Plan a whole range of budgeting target against each Salesman / product / period based on potential Closed Won
- Keywords:
- forecast budget plan control followup goal
- Release Date:
- 2010-02-27
- License:
- Vizsage
- Price:
- Free
Plan a whole range of budgeting target against each Salesman / product / period based on potential Closed Won.
Forecasting provides real-time insight for tracking the sales against opportunities, which helps the organization to fine-tune the sales process. For sales managers, forecast feature provides an overall picture of the company's sales pipeline, as well as those of individual staff performance. Sales representatives can use forecasting to meet/exceed quotas assigned to them and in turn increase company profits.
This module has been created to automatically control the sales against three values: quota (minimum amount of sales permitted), committed (amount of sales negotiated with the sales person) and best case.
Once configured, the values will automatically be calculated and saved in their corresponding field for future reporting with no additional work to be done by the users or managers. Each user will simply have to follow through with his potentials to get his forecast calculated in each defined period.
The available fields to define the a forecast make it very flexible. Year, frequency and period are mandatory. These three fields define the grouping of the opportunity totals. For example, if we want to control the first semester of 2012, we will create a forecast with the values, 2012, semester, 1 (first period). Once this has been created, each time we save an opportunity in state closed won with closed date inside the first semester it's amount will be accumulated into this forecast record.
We can easily create other forecasts for overlapping periods and all of them would be calculated, so we could set two quarterly forecasts and goals and a global forecast for the semester and all of the values would be calculated and associated accordingly to the correct forecast.
On the forecast record we will find all the associated opportunities separated by months for easy access to the related information
The forecast module permits us to fine tune our company's goals more precisely. We can indicate that we want to control the sales on a per user base. In this case, not only would we get the opportunity sales in the indicated period but the application will accumulate only the sales of that user. So we could have a forecast for each of our users in different periods.
Additionally we can also configure the forecasting to accumulate based on product categories or specific products or services. Each forecast record shares the product category picklist so we can accumulate sales based on specific product or service categories and they also have an option to select one given product or service to accumulate against it, so we can closely follow sales of special or promotional products.
All these different accumulating options are controlled by different combinations of checkboxes as detailed next:
- Only Related: this check box indicates that this forecast will accumulate only on those potentials that have the same related product/service as the value in the field "Related to". NOTE: if this is selected together with the "Use Category" option, some inconsistencies may occur.
- Use Category: this check box indicates that this forecast will accumulate on those potentials that are related to a product/service in the same category as the one selected in the Category picklist. NOTE: if this is selected together with the "Only Related" option, some inconsistencies may occur.
- Only assigned to: this indicates that this forecast will accumulate only those potentials that fulfill the previous options AND belong to the same user associated to this forecast. This permits us to control individual goals of our sales men.
We have modified the reporting system to establish the relations on the forecast module permitting limited reporting capabilities within the vtiger CRM application.
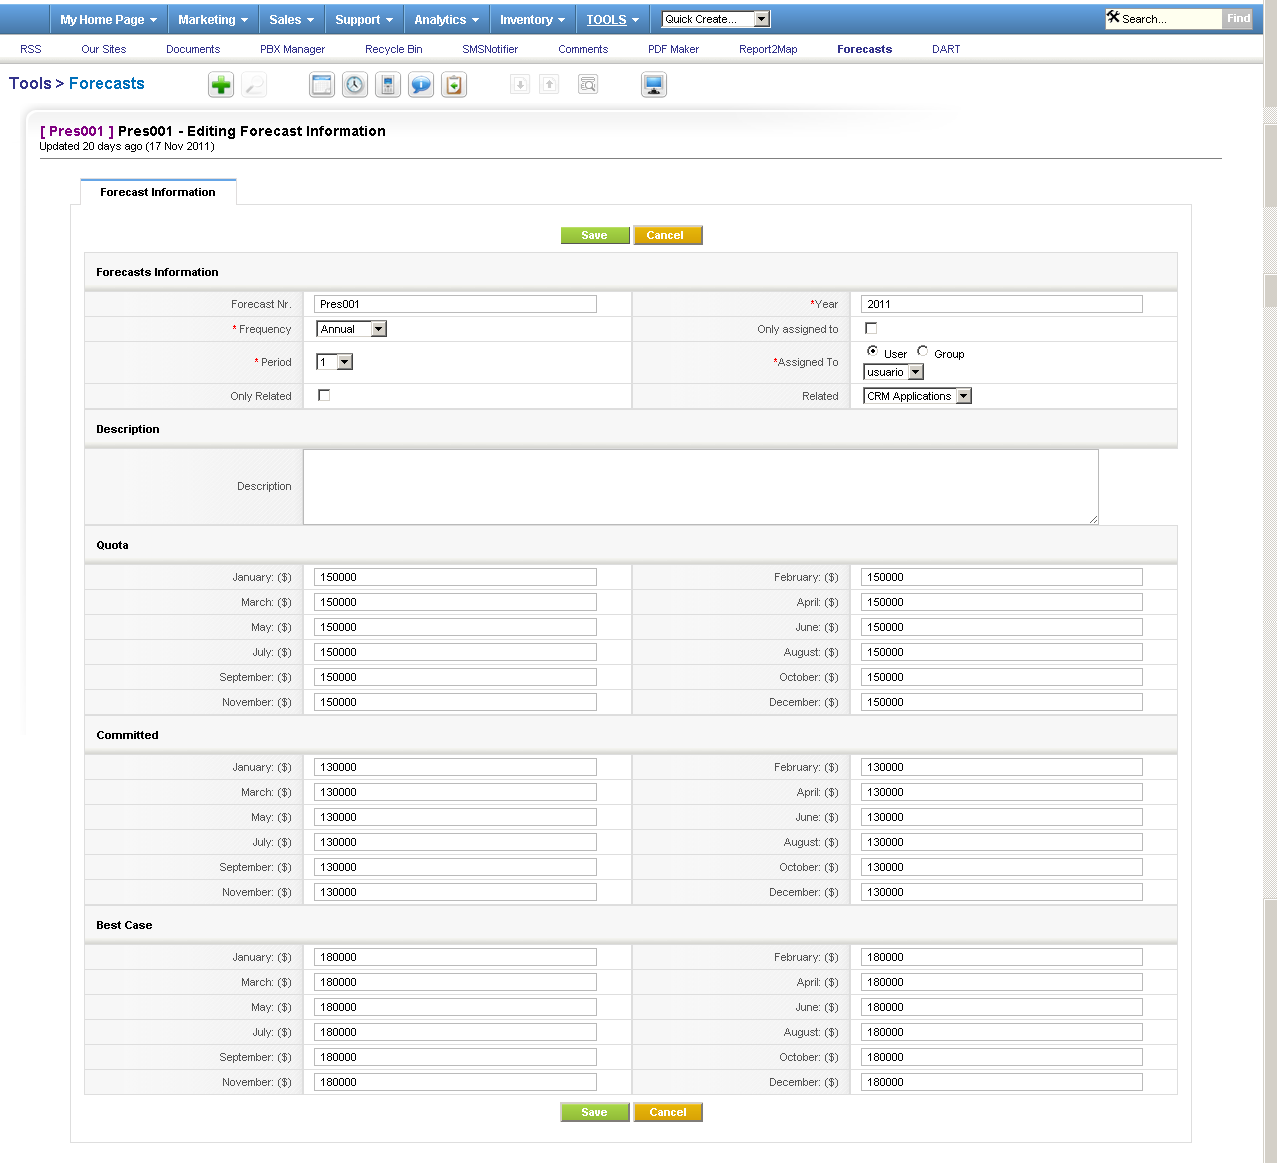
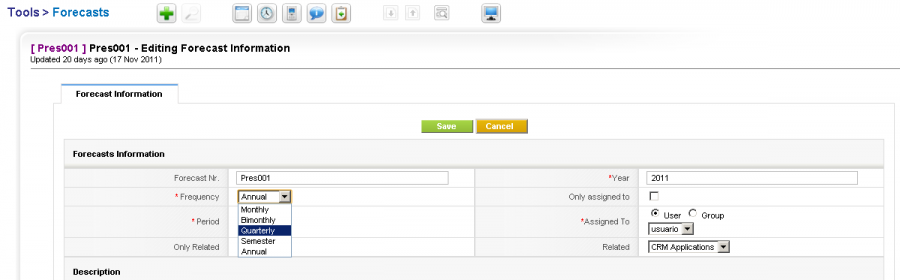
The next two images show the configuration fields and options in the product category based version:
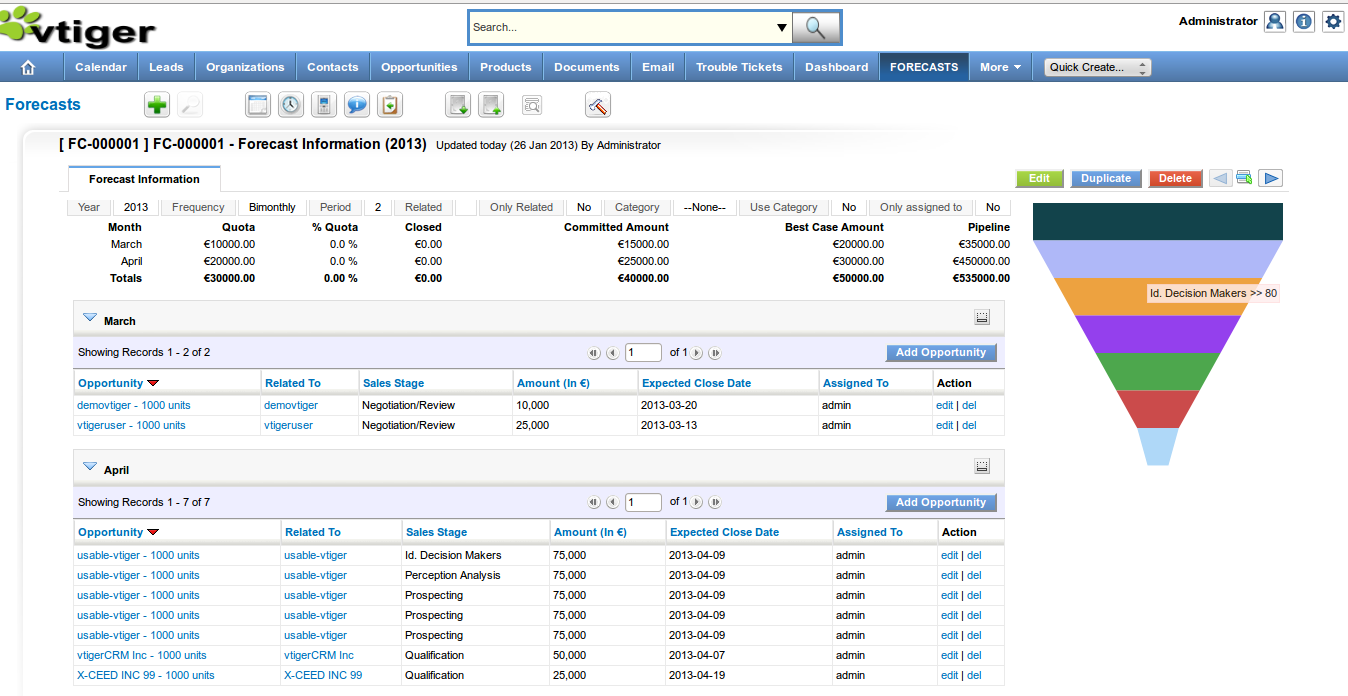
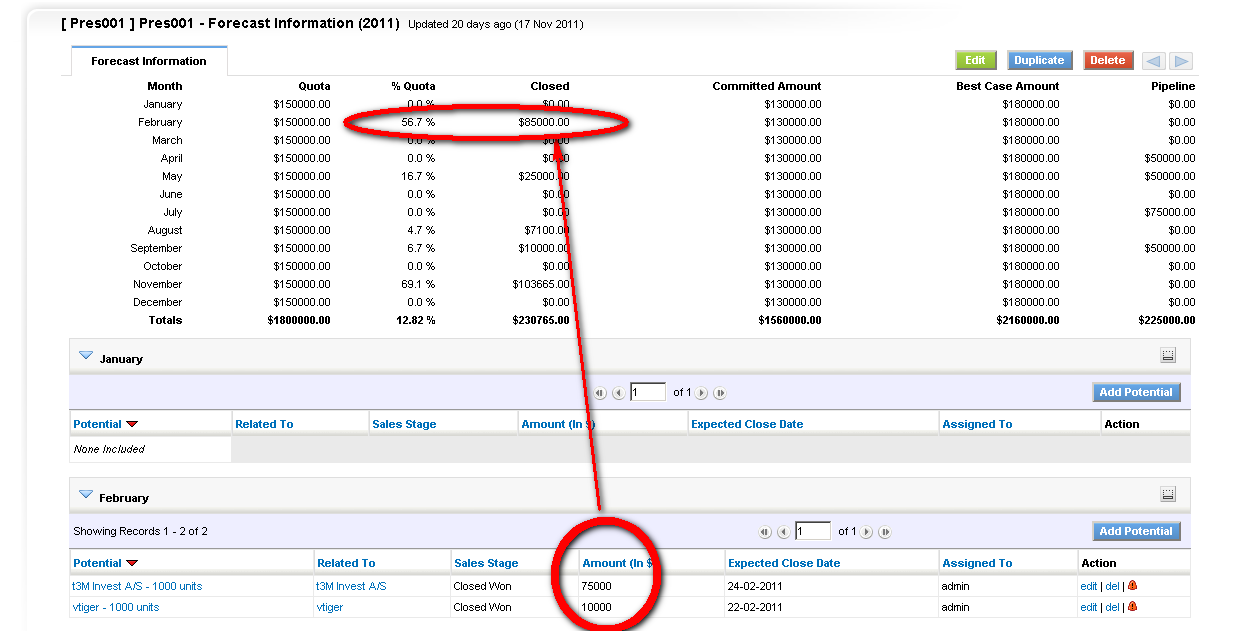
The next image shows the detail view of a forecast record and it's relation with the opportunities:
Detail view explanation of values:
In the next image we can see a list of established values and two related opportunities. Lets try to explain the values for February. As you can see there are 2 opportunities related to this forecast in February. They sum a total of $85000 and they are both in state Closed-Won, so the total can be seen in the Closed column. In this case there are no other opportunities in other states so the pipeline column shows a total of $0, if there were the sum of those would appear in the Pipeline column. When this forecast was created, it was agreed that the minimum amount of sales for February would be $150000 (quota column), the sales man committed to making at least $130000 of sales (this doesn't make much sense as the committed value should be superior to the minimum quota), and they both agreed that the ideal amount would be $180000. All these three values can be seen in their corresponding columns. This leaves us only with one more column to explain. The percentage quota column is calculating how close the sales man is to accomplishing his goal. In this case, his goal was to sell $130000, and he sold $85000, so the percentage is 56.7%, he is more than half way to accomplish his goal for February.
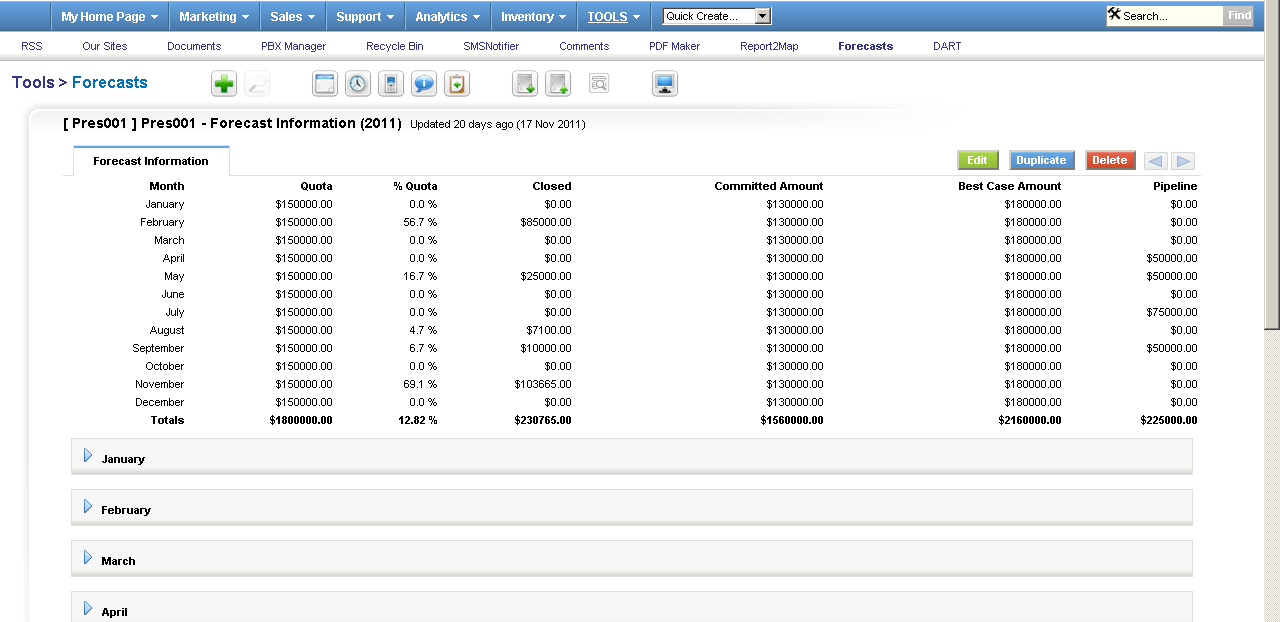
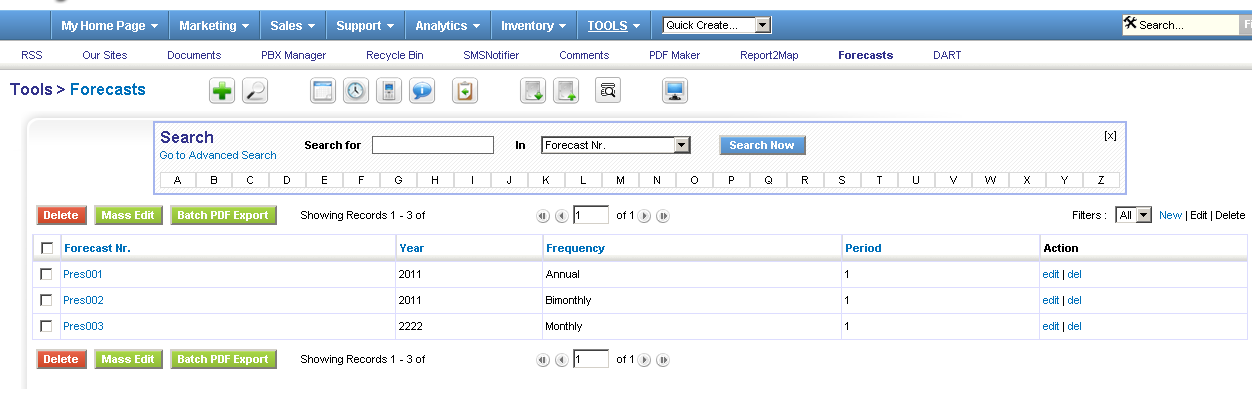
Here we see the list view:
This extension is almost completely vtlib compatible except for the modifications in the reporting system.
FAQ
Looking at the graph en the image below, shouldn't it be a funnel or similar graph?
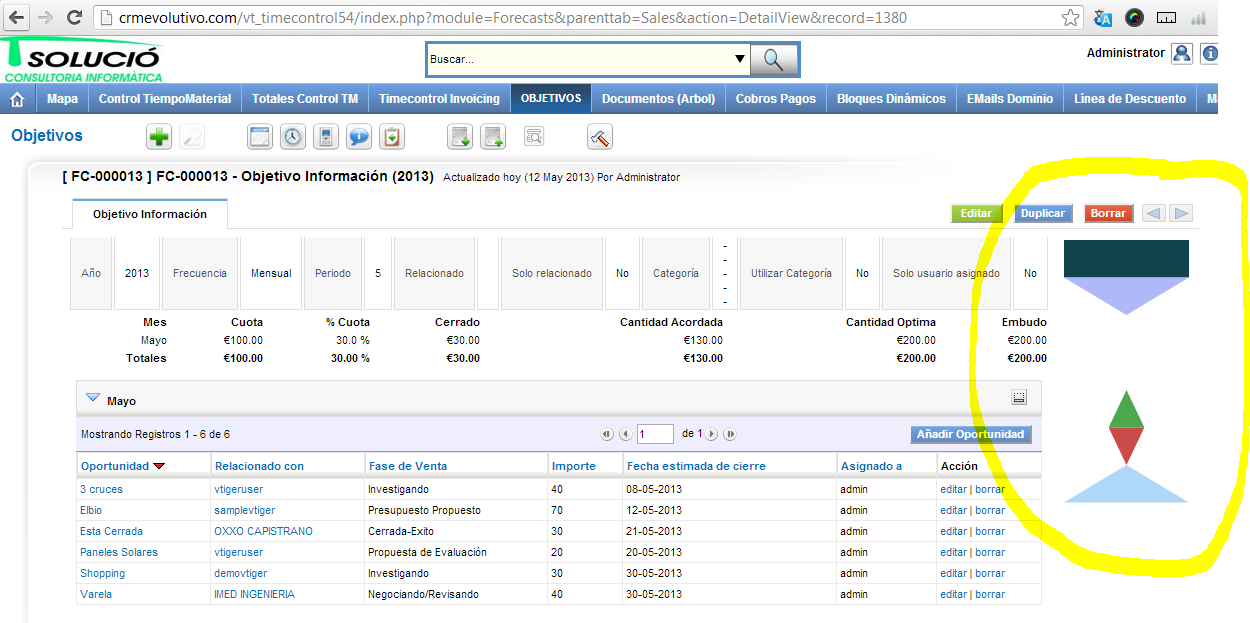
The graph is drawn based on the status of the related opportunities, if your sales process doesn't look like a traditional funnel then this will be reflected in the graph. For example, in our company we do very little prospection, almost all our opportunities are like you which arrives in an advanced status of the sales process, thus, our graph is more like a top, fat in the middle. In the image above there are status with no opportunities and that is why they are empty.
Is it possible to select more than one product associated to a forecast?
You can only relate one product to a forecast directly, BUT you can create forecasts based on product category, so if you create a new category (picklist editor) and put various products inside that category then you can control more than one product in the forecast.